Labour Intelligence Dashboard
A labour-market intelligence dashboard for government ministries, combining official statistics with live data from a national job portal, one country at a time.
Overview
This dashboard runs inside National Talent Portal, the multi-tenant job-matching platform we built for governments across the Eastern Caribbean. It gives ministry and national statistics office staff a per-country view of labour-market health, pairing official government figures with real hiring activity happening on the portal.
In development
Status
30
Indicators Tracked
15 macro + 15 extended
15 min
Refresh Cycle
live portal rollups
Problem
Ministries need a single place to see labour-market health, not just portal activity. But most of what actually matters — unemployment, wage growth, GDP, gender pay gaps — isn't something a job portal generates on its own; it comes from a national statistics office on its own reporting cycle. The dashboard had to keep both kinds of data side by side and clearly labelled, so a number is never credited to the wrong source.
Architecture
This dashboard shares its NestJS and MongoDB backend with the wider portal, with its own schema for jurisdiction-level data — one document per tenant and country code.
@Schema({ collection: 'jurisdiction_intelligence', timestamps: true })
export class JurisdictionIntelligence {
  @Prop({ type: Types.ObjectId, required: true, index: true })
  tenantId: Types.ObjectId

  @Prop({ required: true, trim: true, uppercase: true })
  countryCode: string // ISO 3166-1 alpha-3

  // stewarded by government / NSO input
  @Prop({ type: Object, required: true, default: {} })
  macro: Record<string, number>

  // derived from the portal's own data, not entered by hand
  @Prop({ type: Object, default: {} })
  platform?: {
    registeredCandidates?: number
    verifiedEmployers?: number
    activeVacancies?: number
    applicationSubmissions?: number
    placements?: number
    lastComputedAt?: Date
  }
}macro is entered by authenticated ministry or statistics-office staff. platform is computed
from the portal's own operational data. The schema keeps the two apart on purpose, so a number on
screen is always traceable to whichever side produced it.
The Indicator Catalog
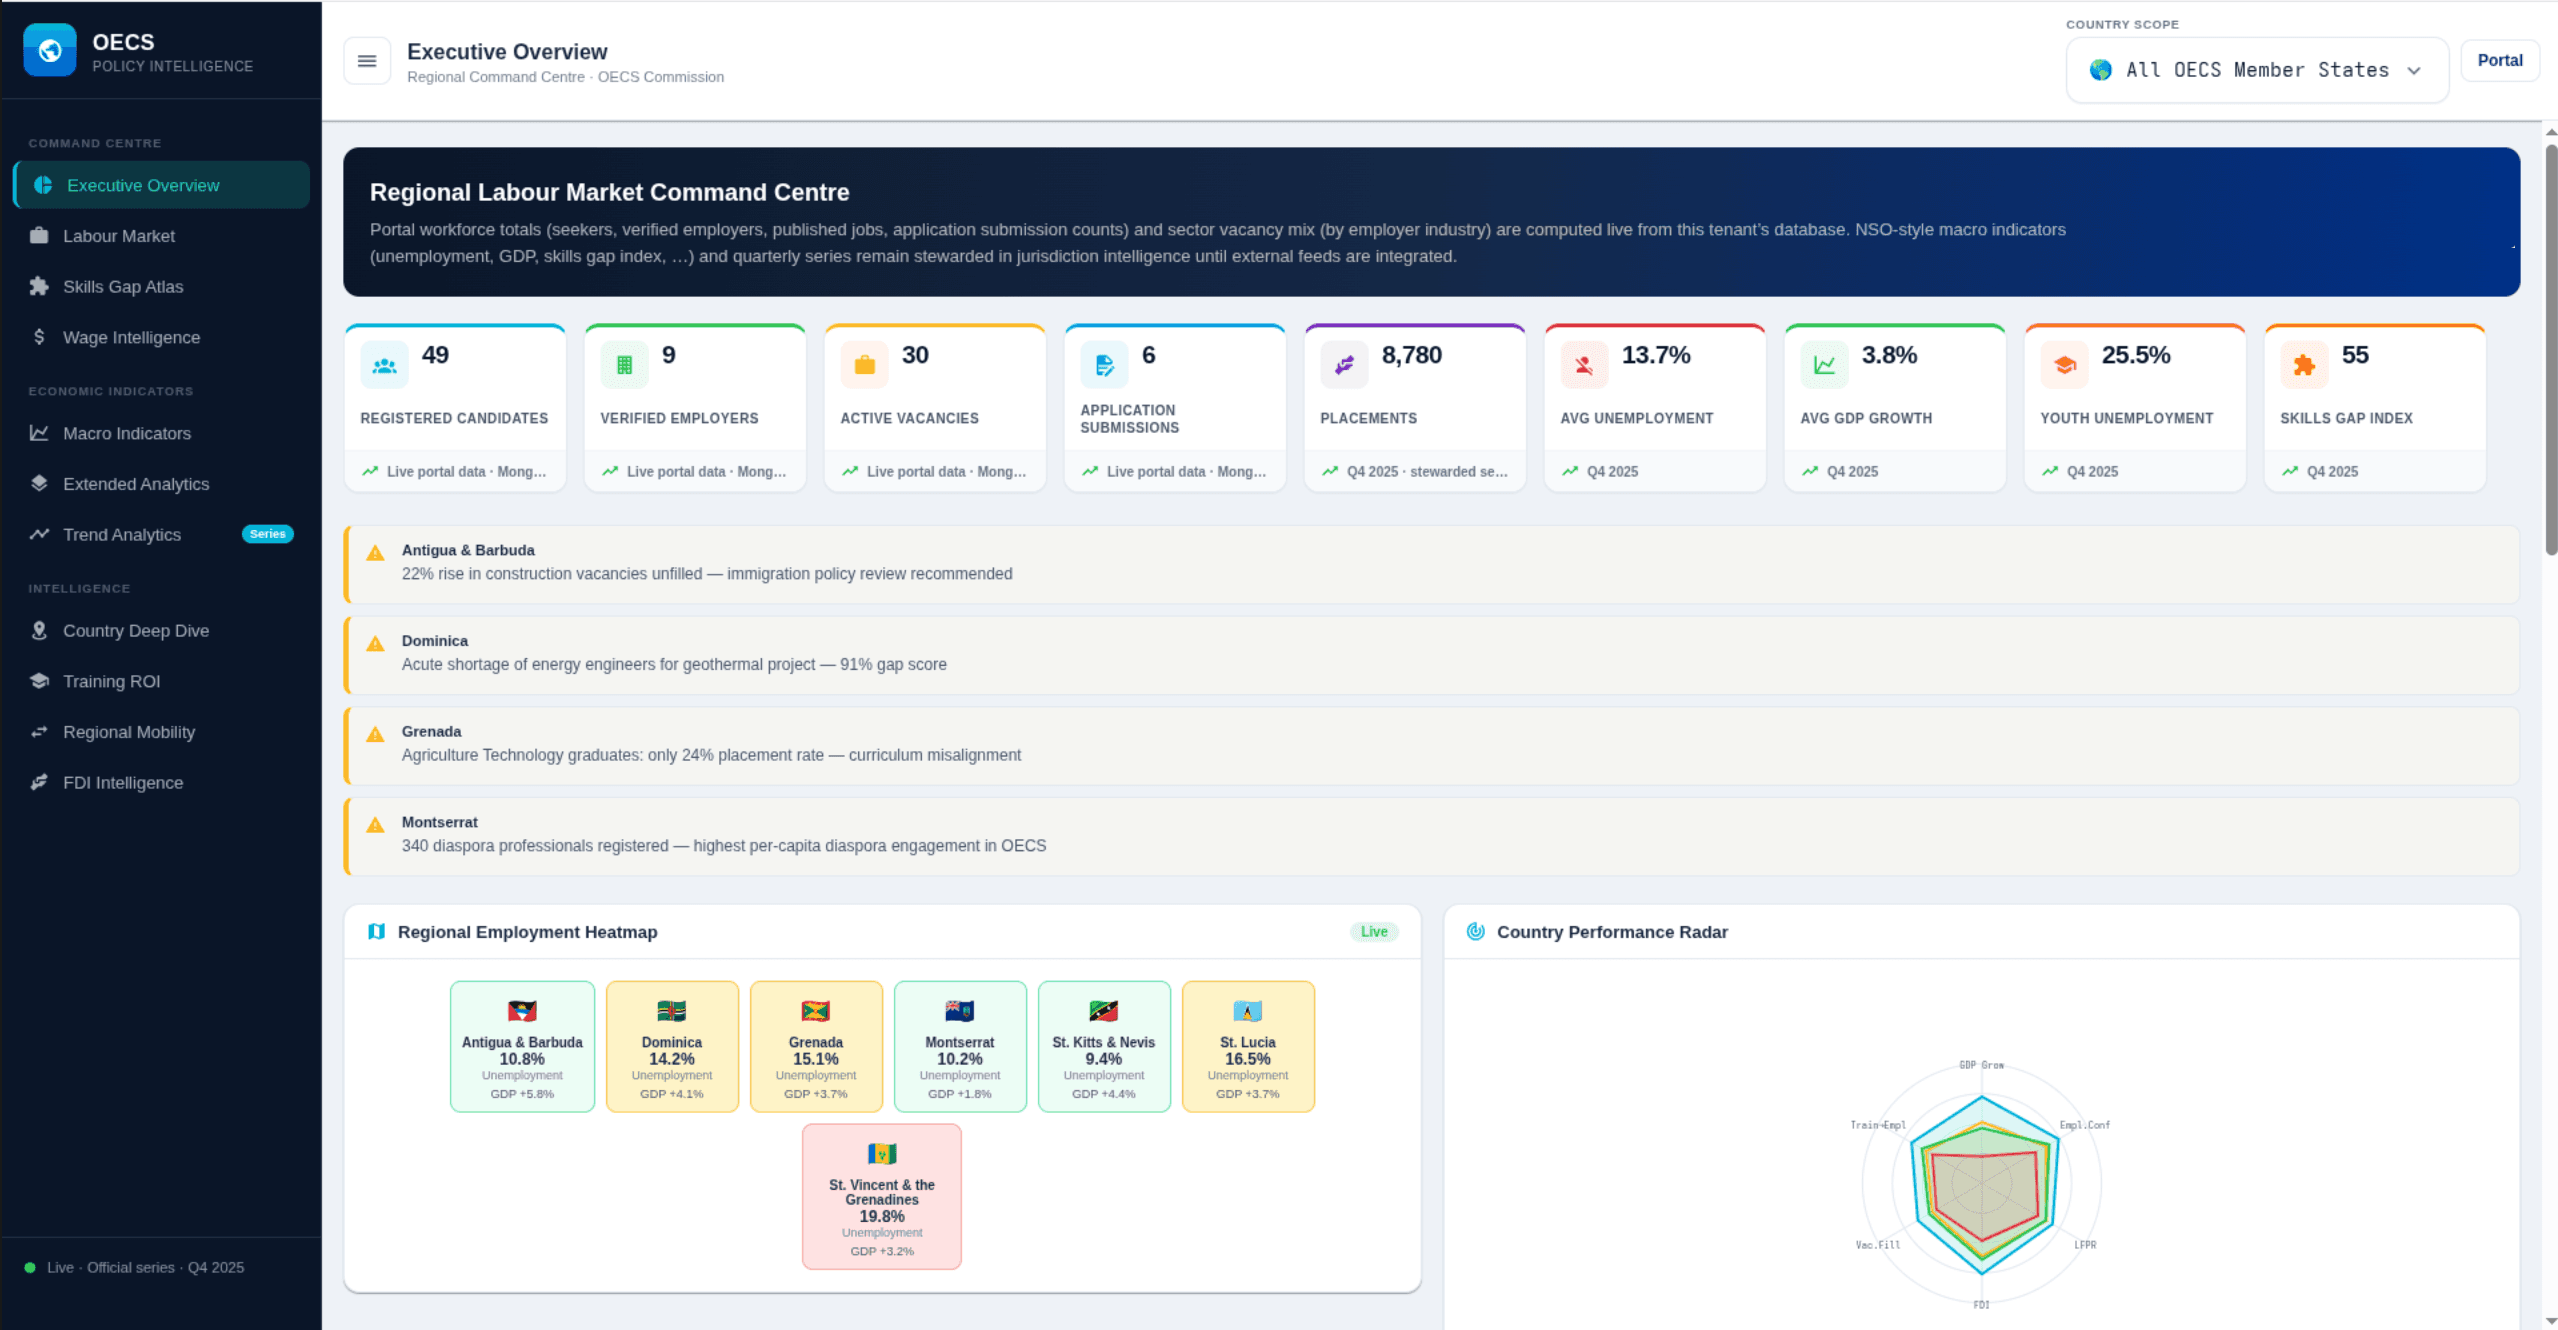
The catalog covers thirty indicators across two tiers: fifteen macro indicators — unemployment, youth unemployment, GDP growth, labour force participation, gender pay gap, FDI attractiveness among them — and fifteen extended indicators, including brain drain, digital skills readiness, and inter-island labour mobility. Each one carries a target and a direction, so the dashboard can show whether a country is trending the right way, not just report a raw number.
Live Portal Rollups
A scheduled job recomputes registered candidates, verified employers, active vacancies, applications, and placements every fifteen minutes, and merges them into each country's record alongside the government-supplied figures.
/** Every 15 minutes (six-field cron with seconds). */
@Cron('0 */15 * * * *')
async persistPlatformCaches(): Promise<void> {
  const r = await this.policy.persistPlatformRollupsForAllTenants()
  this.logger.log(
    `Platform aggregates persisted: ${r.jurisdictionsUpdated} jurisdiction rows across ${r.tenants} tenants`,
  )
}Trend, Not Forecast
The dashboard shows a trend view built from the official quarterly series ministries already supply, labelled clearly as a continuation of that data rather than a prediction. For a dashboard ministries will act on, being explicit about that distinction matters more than looking impressive. Actual forecasting — projecting an indicator forward rather than just charting its history — is scoped for a later phase, once enough quarterly history has accumulated per country to validate a model before anyone relies on it.
Tradeoffs
The indicator catalog is a display and target schema — key, label, unit, target, direction — rather than a heavier per-field data-quality model. Provenance is tracked once per country record instead — steward agency, data vintage, source, methodology — rather than duplicated across all thirty indicators. That was the right amount of structure for the first version of this.
Outcome
In-progress. The indicator catalog, the jurisdiction data model, and the live portal rollup pipeline are built and working. Forecasting is scoped for a later phase, once real historical series have accumulated per country.